DASHBOARD

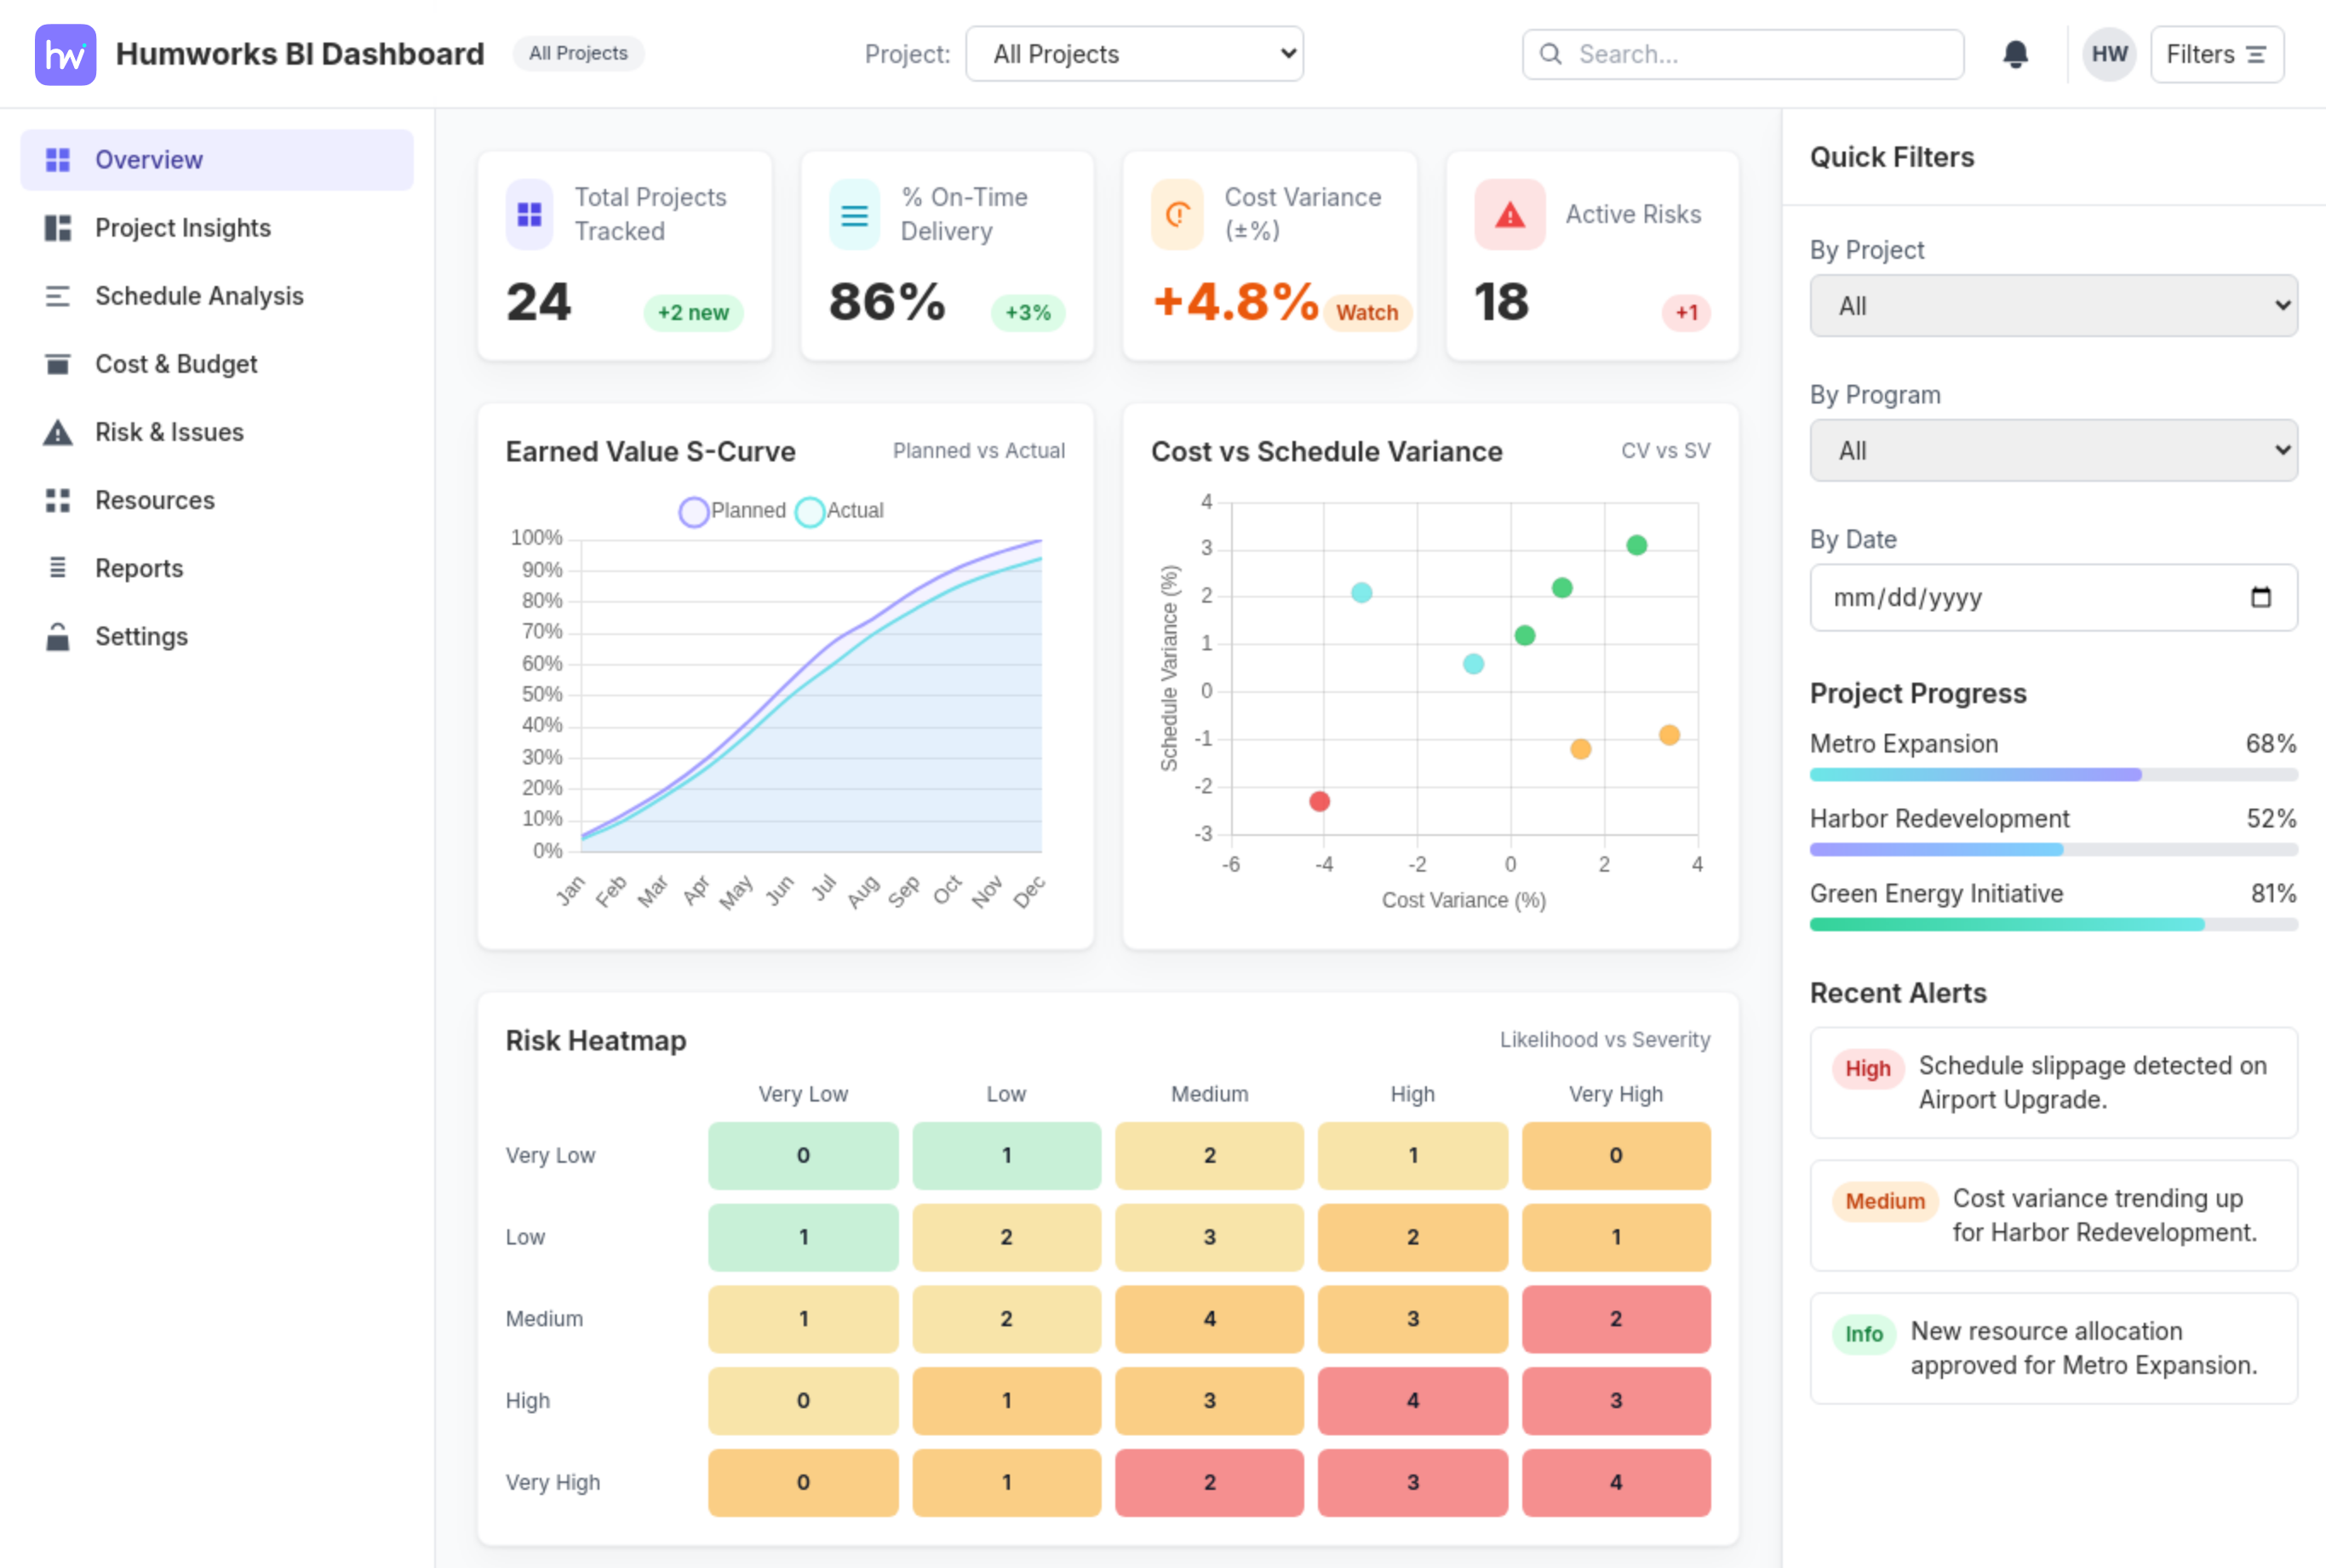
Real-Time Visibility Into Your Entire Project at a Glance

Track, monitor, and analyze every aspect of your project from a single, unified dashboard. Access real-time data, intuitive visual reports, and actionable insights that not only keep your team aligned but also enable faster, smarter decision-making. With everything centralized in one place, you can stay in control, anticipate challenges, and keep your project on track with confidence.

Powerful BI at a Glance

Turn complex data into clear, actionable insights

Powerful Features for Project Success

Built for project managers and executives to lead with data clarity.

Real-Time Data Monitoring

View critical project KPI's live with instant updates and notifications.

Risk & Incident Overview

Immediate insight into high-risk activities and potential issues.

Interactive GIS Map Integration

Visualize risk zones and site progress with interactive mapping.

Customizable Reports & Export

Generate compliance-ready reports instantly with custom formatting.

Audit Trail Logging

Every action is logged for accountability, giving you full traceability of changes, inputs, and approvals.

See the Dashboard in Action

Real-time insights that drive better decisions

Risk by Type Analysis
Visual breakdown of risk categories across your project.
Open vs Resolved Trends
Track issue resolution patterns over time.
Live Activity Feed
Visual breakdown of risk categories across your project.

Why Use the Dashboard?

Prevent Costly Delays

Early warnings help you stay ahead of potential issues.

Improve Collaboration

Centralized data keeps your entire team aligned.

Clear Insights

Simplify decision-making with actionable data.

Enhanced Safety

Proactive monitoring reduces workplace incidents.

Always-On Visibility

HUMWORKS gives you complete control and clarity with our real-time dashboard.

1

Get Instant Overview

View key project KPIs like progress status, risk levels, and alerts — all in one intuitive dashboard.
2

Track Field Data Live

Monitor site updates, environmental sensors, and incident logs in real time with seamless data sync.
3

Visualize Risk Zones

Interactive maps show high-risk areas and active incidents, color-coded by severity and location.
4

Stay Alert with Notifications

Get immediate alerts on critical risks or delays — sent to your desktop or mobile devices.
5

Generate Performance Insights

View charts and trends to understand delays, resolutions, and team responsiveness over time.
6

Make Smarter Decisions

Use real-time data to optimize schedules, resources, and risk mitigation for every project phase.

Why It Matters

Real results from real projects
Business Increase
87
Continuous Monitoring
24 / 7
Digital Traceability
100

In a Nutshell

Real-Time KPIs

Instantly monitor key performance indicators like project progress, delays, and risk levels.

Interactive Site Maps

Visualize active tasks, risk zones, and incident reports on an easy-to-navigate site map.

Customizable Widgets

Personalize your dashboard to display the data that matters most to your role.

Role-Based Access

Project managers and executives see tailored data views for smarter decision-making.

Seamless Data Sync

Pull data from IoT devices, field reports, and schedule updates — fully synchronized.

Historical Data & Trends

Analyze past performance, spot recurring issues, and prevent future delays.

Secure Cloud Storage

All logs and reports are automatically backed up with audit-level security.

One-Click Reports

Export project summaries, risk assessments, and daily reports in PDF or Excel format — no manual work.

Ready to Transform How You Manage Projects?